Issue Introduction
I was asked if I knew any reason why SQL Agent would be using “a bunch” of memory and more cpu than normal. You and I, reader, now have the same information to go on. What do you do? Think about for a minute or two if you want before reading on. I’m not saying the way I did it was the way to do it or the only way, but I gave an action plan for data capture and once data was in hand, was solved in a few minutes. There are all sorts of things that can cause this in a program, but Agent typically doesn’t use a whole lot, unless it’s executing many concurrent T-SQL jobs (which, it really shouldn’t be, get enterprise level scheduling) and even then, the memory should deallocate.
Questions That Need Answered
1. Why was Agent using memory and not letting it go?
2. Is this a bug in SQL Agent?
3. Could Windows patching cause this?
4. Is this some 3rd party software such as antivirus causing it?
Initial Data Collection
We don’t know a whole lot and we’re trusting the person who told us what we know that indeed what they said is correct. If this truly has to do with memory allocation, we’d like to get the stack that’s allocating the memory and a dump of the Agent process, if possible, a minute or so after it gets into this situation. To do this, I opted for WPR, procdump, and perfmon. WPR has been shipping by default with the Windows Server OS since (I believe) Windows Server 2016. Procdump is a sysinternals tool, but it’s nice to use to get the memory and handle tables for processes and do it relatively quickly. We don’t want to use sqldumpr here because this isn’t the SQL Server process, this is Agent.
Since we wanted to see memory allocations (and potentially but not directly needed, deallocations) there’s a few ways we could get this. I opted to use VirtualAllocations since the VirtualAlloc set of Windows APIs are the foundation of memory management in Windows. Whether you’re using the default heap, you’ve built your own heap manager, or any of the managed (or unmanaged) _new_ operators, it’ll all eventually be funneled down to the VirtualAlloc APIs. To make sure we get stacks and to potentially investigate the CPU usage and added CPU and also handle for good measure: wpr -start cpu -start virtualallocation -start handle
Procudmp is trivial, procdump -ma PID where the ma option is to write a full dump as that will have all of the memory from the process and no just stack indirect.
Clarifying The Issue
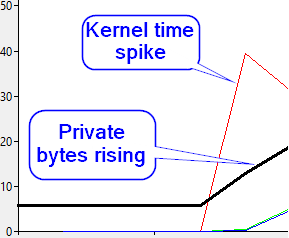
Since I was skeptical that Agent would indeed use up a good deal of memory, I wanted to see if there was any captured data which already showed the issue. Indeed there was a perfmon capture which had the requisite data. Looking at the Process(SQLAGENT)\Private Bytes counter, it was clear there was something odd going on. Below is an example, showing private bytes starting to creep up over time, while privileged time for the process also spikes – which is due to the fact that the transition to kernel mode to allocate the memory is required and is a fairly expensive item. Note that this screenshot is only a reproduction of the problem and is in no way the original data.

Checking The Collected Data
Now that we have the WPR and dump, let’s take a look. First place to start is in the WPR (etl) data, as it’ll let us hone in on what we’re after. Gathering the VirtualAllocations data should give us the virtual allocations by time (and size and a bunch of other things) which we want to then bucket into what’s called the “commit type”. This is just a way to analyze the memory allocation in a way that lets us focus on what type we’re after, this isn’t an actual programming API or anything. There are four types, Allocated Inside Freed Inside (AIFI), Allocated Inside Freed Outside (AIFO), Allocated Outside Freed Inside (AOFI), and Allocated Outside Freed Outside (AOFO). So, what the hell does this mean and why do we care? The allocation location (Inside/Outside) is telling us if the memory allocated was done inside of the collected trace data or outside of the trace data, and the Freed is the same thing but for when that memory was freed. In this case, since we started the collection when the memory started trending upwards, we’re going to look for items allocated inside of our traced data, but freed outside of the trace data, because we only collected a minute or two of tracing – so it most likely wouldn’t have been deallocated by the time the trace was completed.
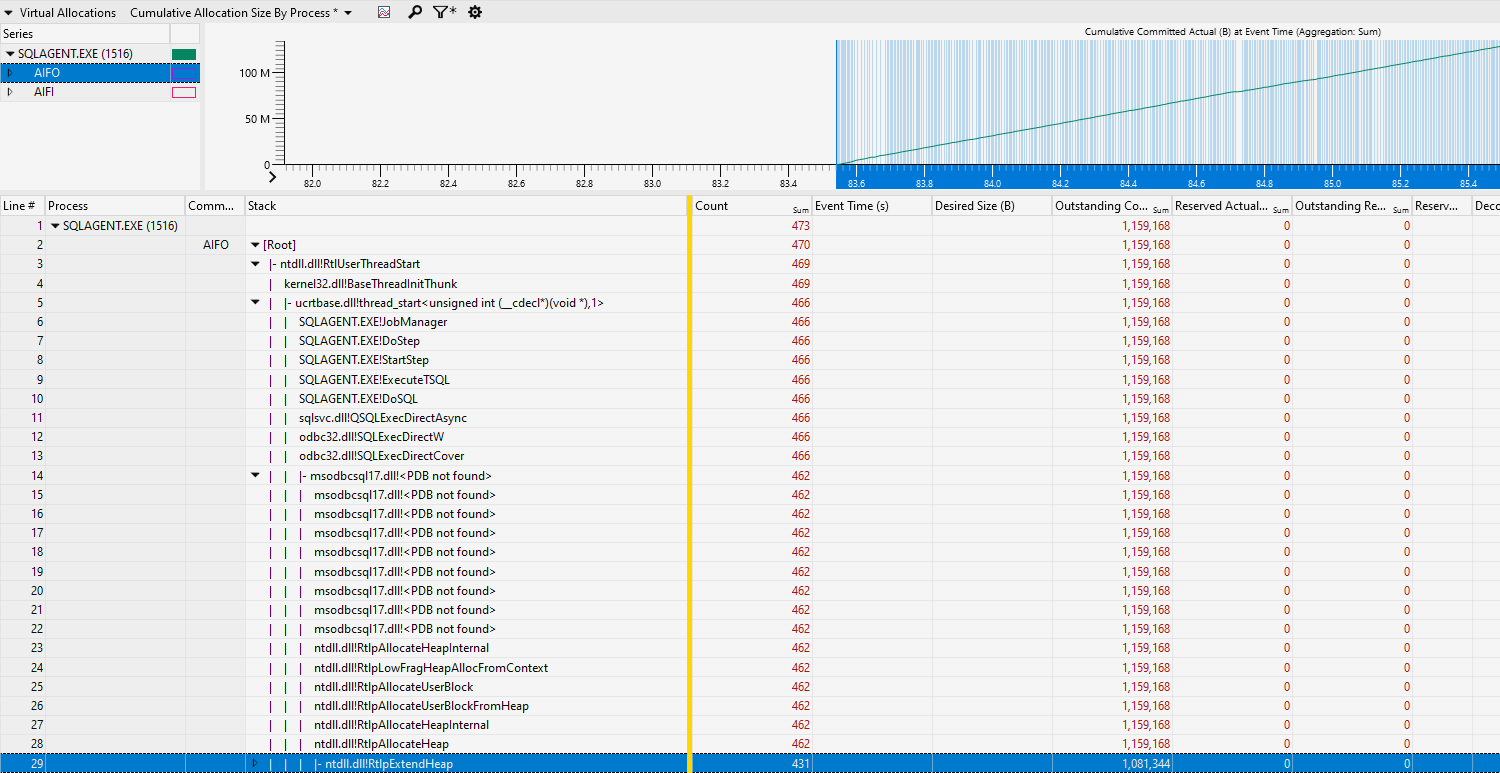
Knowing we’re going after AIFO, let’s setup our analysis view and look for stack under the SQL Agent process.

You can see that AIFO does seem to be what we’re looking for here, the allocated bytes is trending up just as we saw in the perfmon and we can see that is were almost all of our allocations are in this capture. Let’s add our stack and take a peek.

Great! We can see that this is a job running a job step, specifically a T-SQL step, by frames 6 through 13. Sadly, I’m currently having some symbols issues with msodbc17 driver so the stacks aren’t currently showing (couldn’t find the PDBs on the public symbols server as of writing). In this case, the driver was processing Information or error messages so it would see that the driver was allocating memory so that data returned from SQL Server could be stored and consumed. Just from this short analysis we can narrow this down to a job running T-SQL, but sadly we don’t know which job or what T-SQL. Here is where we can use information from multiple sources, the wpr etl capture, and the memory dump. Memory is allocated on page boundaries and we can see the addresses that were allocated and committed – since this seems to be processing data in some sort (information messages, error messages, etc.) then there’s a good chance it could be human readable and in a text format. Taking a random address in our wpr data, and going over to the dump might help us get some extra information. Please note that, with public symbols, which we have here, there is no way to see the locals for the stack frames. If we had private symbols there’s a good chance we could get more information from that, but we work with what we have.
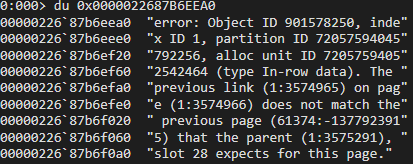
Taking a random address to the dump and with a little bit of handy work, we can dump out the memory and tell the debugger to interpret it as character data (using `du` to dump as Unicode). There are two types, ansi and Unicode, and typically everything modern is going to use Unicode. Moving the address back a little in memory from the random allocation we can see the following. Note that, in this case, the page boundary would be 0x0000022687B6F000 as Windows uses a 4K page for memory, which is the last 4 digits in hex (0x1000 = 4K, so each page boundary would be 0x1000 higher or lower).

Well, that’s pretty damning. Astute readers will notice that is typical DBCC CHECKDB output when there is some corruption.
Bringing It All Together and Answering Questions
We know a great deal of information, now, that we can make some fairly logical conclusions. We know that there seems to be what looks like CheckDB output showing some informational (error) messages in the dump memory from allocation data we took from the wpr collection. We know from the callstack this is running a T-SQL jobstep and this is an Agent job. We could make an educated guess that there’s a CheckDB job or something that ends up running CheckDB and there’s a rampant amount of corruption in a database. If your first thought was, “I would tell them to run CheckDB on every database and double check them!” then you’d be right there with me. Indeed this is the advice I had given, and this ended up resulting a database that had a massive amount of corruption.
Let’s answer our questions from before:
1. Why was Agent using memory and not letting it go? Agent was holding space for all of the informational messages sent to it from the engine.
2. Is this a bug in SQL Agent? No, it’s not a bug. I know everyone wants to be the one to find a bug but not in this case.
3. Could Windows patching cause this? No, moving on…
4. Is this some 3rd party software such as antivirus causing it? Nope.
Closing Thoughts
This was pretty interesting, well I thought so enough that I wrote it up and posted it. I think it’s a good learning opportunity for everyone, not just in using tools available to us, but also that just because there a job checking something doesn’t mean anyone is actually looking at the output of said job. In this case, it was a job running CheckDB and no one had looked at it in a long time. Backups were full of corruption.
I have never had to look into SQL Agent before, it was fun even if the results were a bit bad to deliver. Just doing some basic digging can really lead to some awesome learning opportunities 😊
Oh wow that is totally interesting thanks for posting!